Tutorial
Main Functions
Predict
Input data
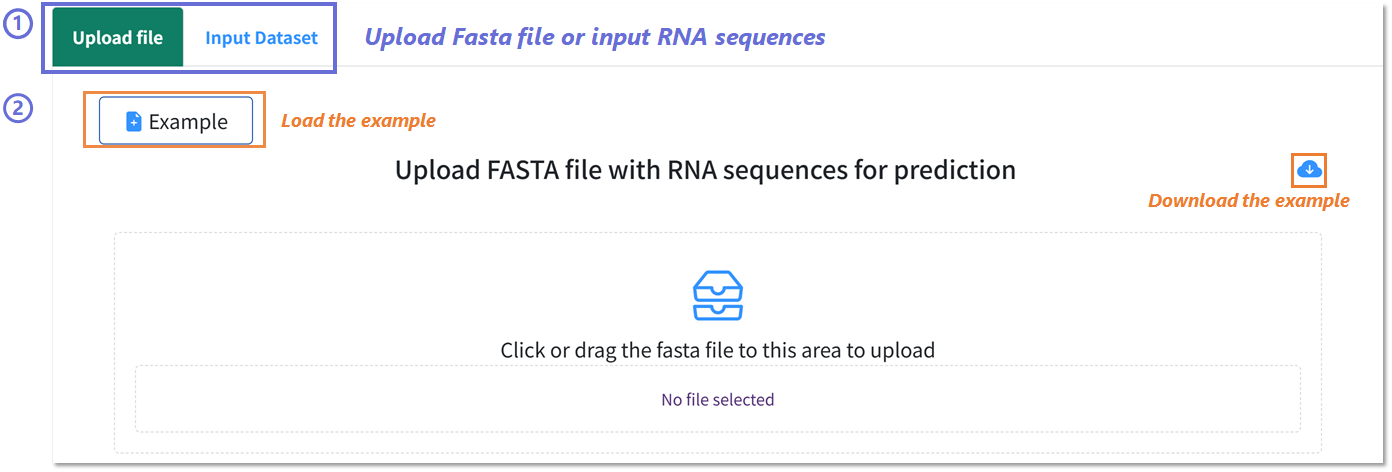
Uploading RNA sequences for prediction in BRIDGE Webserver.
1️⃣ Select upload mode: Choose Upload file to provide a FASTA file or Input Dataset to paste raw RNA sequences directly.
2️⃣ Example data handling: Click Example to load a preformatted demonstration FASTA file, or use the download icon to obtain the example file locally for reference.
3️⃣ File submission: Drag and drop or click within the upload area to select your FASTA file. The interface will display the selected filename prior to processing.
Condition select
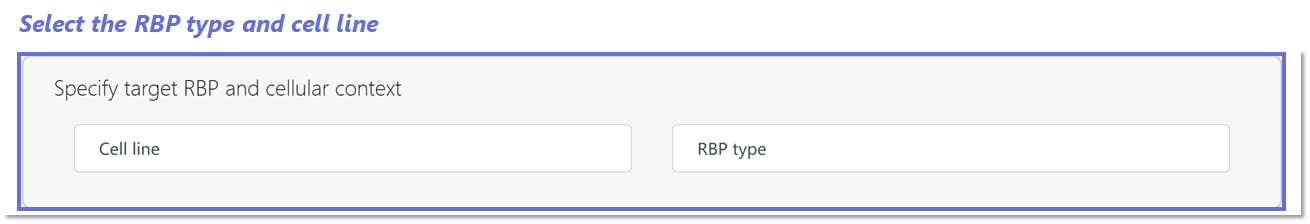

Selecting input parameters for prediction and mutation analysis in BRIDGE Webserver.
1️⃣ Prediction mode: Specify the target Cell line and RBP type to define the prediction context.
2️⃣ Mutation analysis mode: Select the Mutation site, Cell line, and RBP type to assess variant-specific binding effects.
1️⃣ Prediction mode: Specify the target Cell line and RBP type to define the prediction context.
2️⃣ Mutation analysis mode: Select the Mutation site, Cell line, and RBP type to assess variant-specific binding effects.
Submit
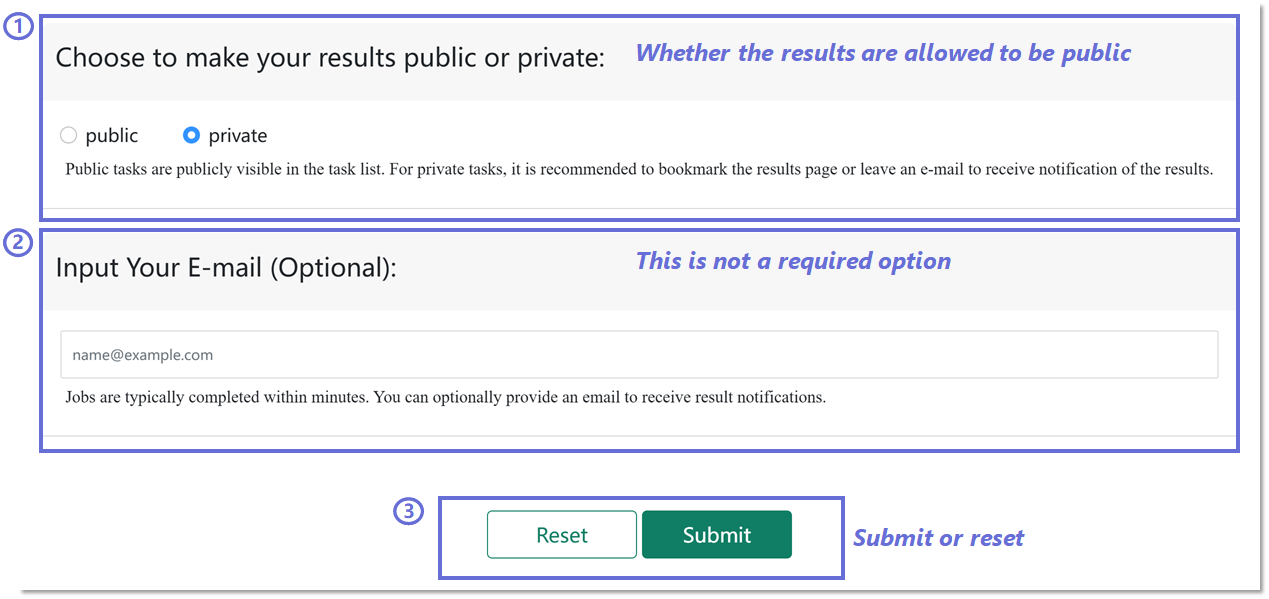
Configuring job submission options in BRIDGE Webserver.
1️⃣ Set result visibility: Select whether the prediction results are public or private. Public tasks appear in the task list, whereas private tasks require bookmarking or providing an e-mail for retrieval.
2️⃣ Optional e-mail input: Enter an e-mail address to receive automated notifications when the job is completed.
3️⃣ Submit or reset: Use the Submit button to start the job or Reset to clear all inputs.
Task List
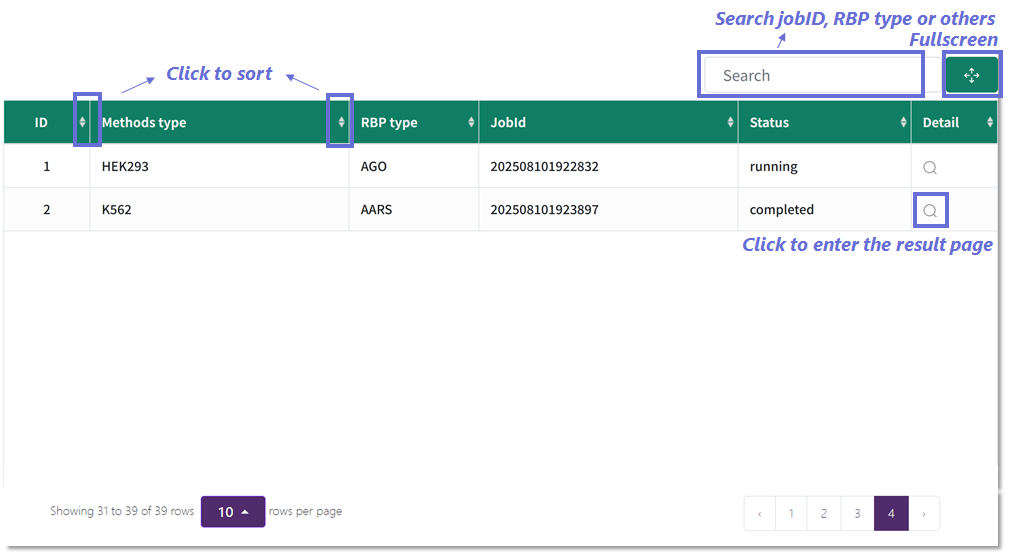
Monitoring and accessing submitted jobs.
1️⃣ Interactive task table: Sort by columns (e.g., Methods type, RBP type) by clicking the sort icons.
2️⃣ Search and filter: Locate jobs using keywords such as job ID, RBP type, or method.
3️⃣ Result access: Click the magnifying glass icon in the “Detail” column to open the result page for a completed job.
Result report
Nucleotide composition
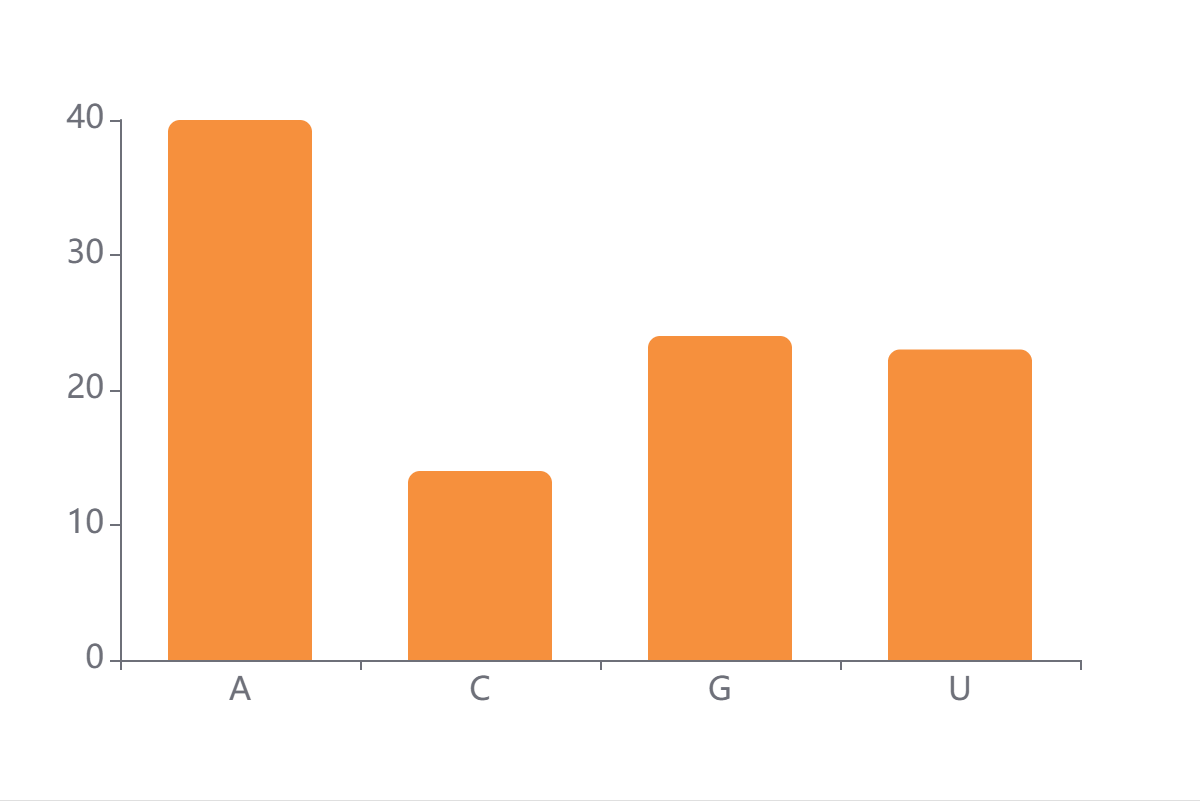
The base composition of all uploaded RNA sequences aggregated over the input (A/C/G/U).
The y-axis reflects the frequency of each nucleotide in the dataset.
The y-axis reflects the frequency of each nucleotide in the dataset.
Predicted score distribution
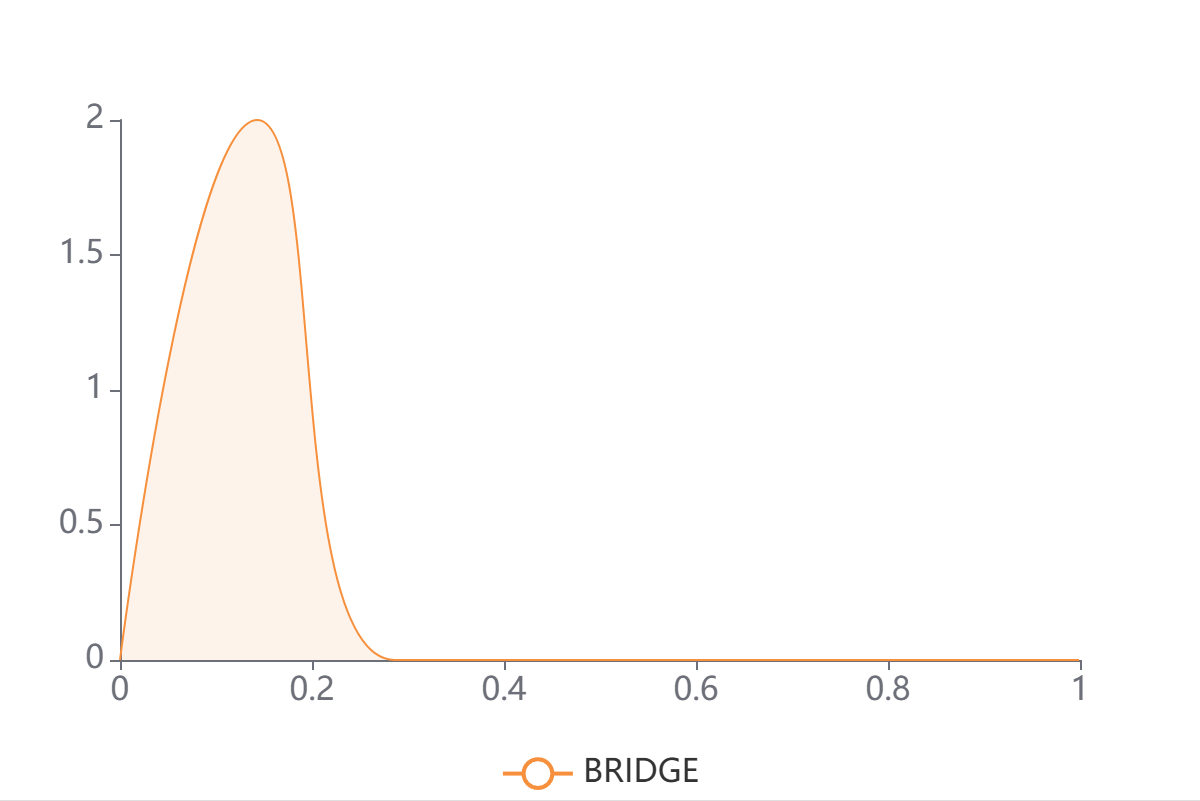
A kernel density estimate of BRIDGE's predicted binding scores p∈[0,1] for the submitted sequences.
Left-skewed curves (mass near 0) imply most sequences are predicted non-binding;
right-shifted curves indicate enrichment for putative binders; a bimodal shape suggests a mixture of binders/non-binders.
Left-skewed curves (mass near 0) imply most sequences are predicted non-binding;
right-shifted curves indicate enrichment for putative binders; a bimodal shape suggests a mixture of binders/non-binders.
Saliency maps

Saliency maps for RBP in different cell lines, illustrating the contribution of sequence and structural features at each nucleotide position.
The top panel shows candidate binding motifs. The second panel presents a SHAP-based heatmap of sequence feature contributions.
The third panel displays the nucleotide sequence. The bottom panel includes two structural features:
a line plot of icSHAPE reactivity scores (with nucleotides labeled as “U” for unpaired if ≥ 0.233, and “P” for paired if < 0.233),
and a heatmap of structure-based attention weights learned by BRIDGE.
RNA secondary structure prediction
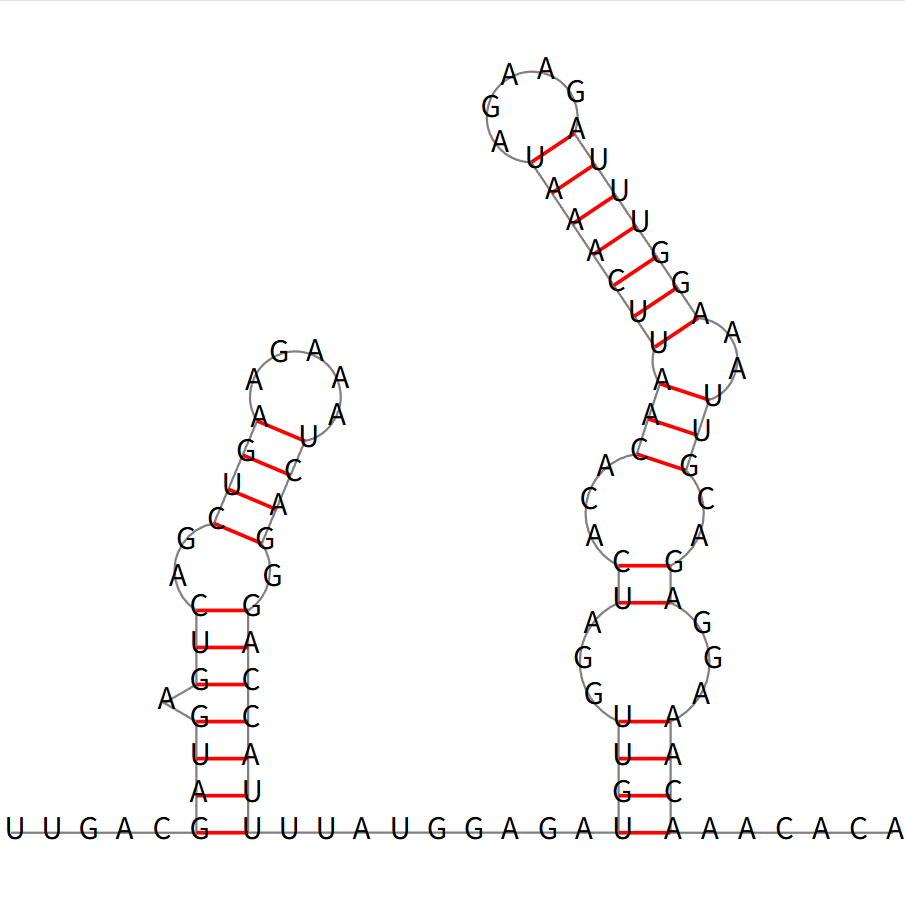
The minimum free energy (MFE) secondary structure of a representative high-scoring RNA sequence, predicted using RNAfold.
Nucleotides are arranged to show base-pairing interactions (red lines) and loop regions.
Attention maps
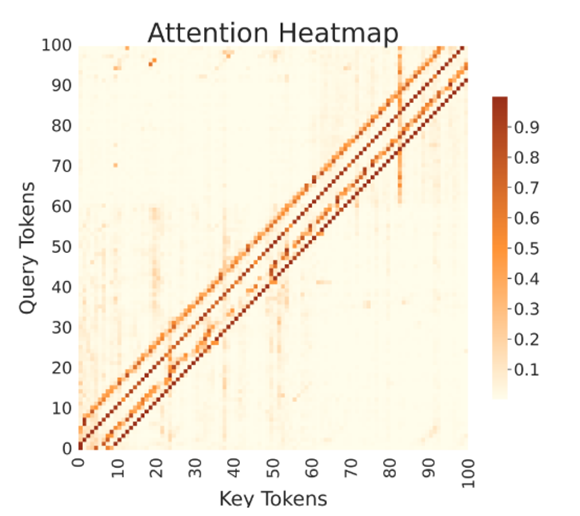
Pairwise attention weights between sequence positions (y-axis: query tokens; x-axis: key tokens; color scale: normalized weight).
The strong main diagonal indicates local context usage; off-diagonal bands reveal long-range dependencies learned by BRIDGE.
Motif analysis

Schematic of attention-based motif extraction in BRIDGE.
Each sequence-structure motif includes a sequence logo (top) and a structural logo (bottom),
where structural contexts are denoted as: L (left-paired), R (right-paired), H (hairpin loop), E (external), B (bulge),
M (multi-loop), and T (internal loop).